 Introduction
CMBS issuance is on track to finish 2019 on a
strong note as the fall in the 10-year Treasury rate
appears to have stimulated borrower demand. The
decline in the 10-year note reflects a slowing
global economy, with investors being drawn to
the relative safety and competitive yield of the
U.S. Treasury. With increased demand, the 10-
year Treasury rate declined in 2019 to levels not
seen since 2016. This likely contributed to the rise
in Q3 2019 conduit volume as commercial real
estate (CRE) borrowers sought to lock in longterm rates.
Introduction
CMBS issuance is on track to finish 2019 on a
strong note as the fall in the 10-year Treasury rate
appears to have stimulated borrower demand. The
decline in the 10-year note reflects a slowing
global economy, with investors being drawn to
the relative safety and competitive yield of the
U.S. Treasury. With increased demand, the 10-
year Treasury rate declined in 2019 to levels not
seen since 2016. This likely contributed to the rise
in Q3 2019 conduit volume as commercial real
estate (CRE) borrowers sought to lock in longterm rates.
Both long- and short-term interest rate movements
have been sizable in 2019. The 10-year Treasury,
which opened the year at 2.66%, dropped to a
year-to-date (YTD) low of 1.47% on August 28.
Over the last five years, (2015 to YTD 2019), the
10-year Treasury recorded its largest percentage
change in 2019 (slightly edging out 2016), from
its high (2.79%) to low point (see Figure 1). For
short term rates, the Federal Reserve has cut them
three times so far in 2019—for a total of 75 basis
points (bps), after effectuating four 25 bps rate
increases in 2018. Federal Open Market
Committee (FOMC) statements noted that the rate
reductions were taken to sustain the economic
expansion and as insurance against ongoing risks.
Tenant demand from job growth, as well as an
historically low unemployment rate and subdued
construction has extended the economic and CRE cycle. This backdrop has helped to support both property
fundamentals and valuations, which have generally eclipsed premarket peaks. And while we are late cycle,
oversupply and overleverage appear to be under control at a national level. Delinquency rates have also remained
relatively low, with CMBS 2.0 conduits posting a 30+ day delinquency rate of 0.89% as of October 31, 2019.
Factoring the current economic climate, low interest rates, and stable credit performance, we believe the stage is set
for CMBS issuance to surpass our forecasted 2019 volume and carry over into the new year. Even though issuance
lagged year-over-year (YoY) through Q3 2019, we believe that full-year (FY) 2019 is poised to exceed the 2018 total
of $75 billion. We also expect that rates will influence deal mix and as smaller to midsize borrowers take advantage
of lower rates, conduit issuance will exceed single borrower (SB) in 2020, after trailing in 1H 2019. Recent and pending
commercial real estate collateralized loan obligation (CRE CLO) deal announcements bode well heading into 2020
and we anticipate that CRE CLO issuance will rise again given investor appetite for yield in a low rate world.
In addition, with low interest rates and higher prices, defeasance activity should remain on solid footing as borrowers
look to refinance their loans. We believe that defeasances are favorable, from a credit perspective, as they substitute
high-quality government-backed securities for a loan’s CRE collateral. For more information on this topic, read our
As Freddie Mac K -Series Defeasance Accelerates, Supplemental Debt Slows report.
But this does not mean that CMBS and CRE issuance will move higher without some disruptions along the way.
Continuing trade talk, impeachment inquiries, global growth uncertainties, and domestic recessionary concerns are
expected to be unsettling headwinds. In the following section, we review the current lending environment as well
as underwriting standards in pre- and post-crisis CMBS followed by Kroll Bond Rating Agency’s (KBRA) forecast
for new issuance in 2020. We also examine the five major property types, highlighting the underlying demand and
supply factors for each sector, as well as our outlook for 2020. In addition, this outlook will discuss the CMBS
conduits that we rated so far in 2019. In the Surveillance section, we look more closely at what drove 2019 ratings
activity, as well as our expectations for rating actions in 2020.


2020 CMBS Outlook: This Time Is Different?
CRE and CMBS Underwriting in the Post-Crisis Era
While we expect issuance to rise, our 2020 CMBS and CRE CLO forecast also considered today’s competitive lending
environment. According to the Mortgage Bankers Association’s (MBA) 2Q 2019 Commercial/Multifamily Mortgage
Debt Outstanding report, compared to Q1 2019, commercial banks increased their CRE mortgage debt holdings by
1.7%, insurance companies by 1.4%, while CMBS, CDO, and other ABS issues lagged with a 1% increase. In addition,
CRE data provider CrediFi found that CRE loans make up a larger portion of banks’ balance sheets than is publicly
disclosed.1 Meanwhile, U.S CRE loan originations by foreign-owned institutions is at a faster pace compared to
domestic lenders, according to a Commercial Mortgage Alert analysis of data compiled by Trepp Bank Navigator.
KBRA expects a continuation of the strong lending competition in 2019 to extend into the coming year and influence
overall securitized volume as well as credit. But while CMBS loan originators maintained discipline for much of
2019, we have observed increases in the concentrations of loan-to value (LTV) and interest-only (IO) loans during
the fourth quarter. This begs the question of whether “this time is different.”
Unlike their predecessors, conduit CMBS 2.0 have generally stayed away from pro forma loans (something we have
yet to see in 2019 despite increased leverage and IO) and utilized in-place cash flows when analyzing and underwriting
CRE loan collateral. In addition, conduit CMBS 2.0 transactions have lower leverage points, but higher subordination
levels, compared to conduit 1.0, which can help to absorb loan losses.2 This lower leverage exists despite 10-year
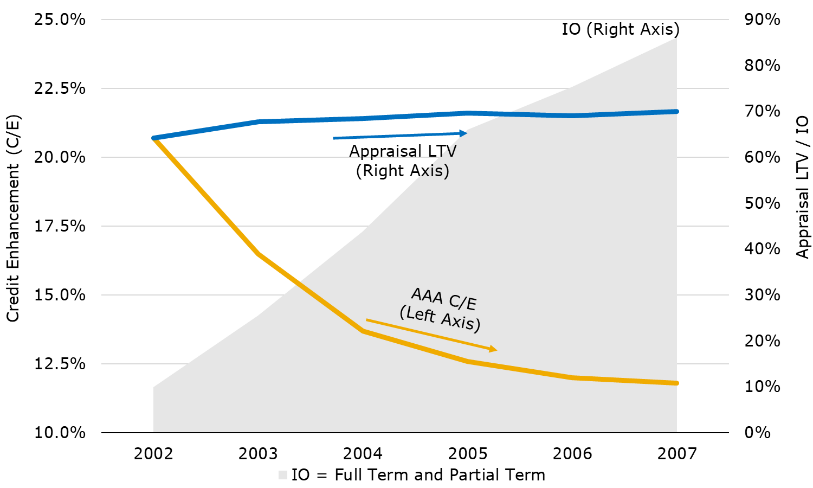
Treasury rate levels, which are now about 225 bps lower (1.75%) than where they ended 2007, at about 4%. As
illustrated in Figure 2 and Figure 3, pre-crisis 2007 AAA and BBB- credit enhancement (C/E) levels stood at 11.8%
and 3.2%, respectively. This compares to post-crisis YTD C/E for AAA, which is almost double at 20.5%, and BBB-,
which is more than double at 6.9% (see Figure 4 and Figure 5). CMBS 2.0 leverage is also lower, with appraisal cutoff
LTVs of approximately 60% through early October 2019 compared to 70% in vintage year 2007.
To remain competitive, lenders have increasingly been using full-term and partial-term IO loans. These IO loan
types (in KBRA rated and non- rated deals) have experienced steady increases in 2.0, with YTD October levels at
58% and 23% (totaling 81%), respectively. KBRA’s IO index at the end of October was at a record high (65.7%)
since we started the benchmark in 2012. In our view, all else being equal, KBRA believes that IO loans are riskier
than amortizing loans, which provide for natural deleveraging over the loan term—and which leads to lower risk of
maturity default. Additionally, should an IO loan default later in its term, it will experience a higher loss given
default (LGD) relative to an amortizing loan, based on its higher outstanding principal balance.
Despite the increasing prevalence of IO, CMBS 2.0 issued to date appears to be better positioned than their 1.0
counterparts based on C/E, underwriting standards, and credit metrics. At this juncture, we believe that existing
issuance, generally, should be better able to weather a downturn in the economy compared to CMBS 1.0, although
performance will vary between deals.
Figure 1: Pre-Crisis: AAA Credit Enhancement, Leverage, and IO %
Figure 2: Pre-Crisis: AAA Credit Enhancement, Leverage, and IO %
Figure 3: Pre-Crisis: AAA Credit Enhancement, Leverage, and IO %
Figure 4: Pre-Crisis: AAA Credit Enhancement, Leverage, and IO %
New Issuance Forecast As discussed back in September in the Spotlight section of KBRA’s CMBS Trend Watch, while securitized issuance may not benefit from the amount of 10-year CMBS loans ($2.7 billion) scheduled to mature in 2020, we forecast an increase in 2020 volume, due to the rate environment and general attractiveness of CRE relative to other asset classes (see Figure 6). The 10-year Treasury, which opened at 2.66% in 2019, fell to a low of 1.47% in Q3, which has helped to generate increased interest in long-term conduit paper. In Q3 2019, conduit issuance increased around 80% to $32.5 billion from $18.2 billion in IH 2019, according to Commercial Mortgage Alert (CMA) data. Concurrently, there was a changing of the guard, with conduit issuance exceeding SB, with 57% of the YTD volume compared to 47% in IH 2019.

For FY 2019, we expect that CMBS volume will end the year somewhere between $86 billion and $91 billion, which would easily exceed the FY 2018 level of $75 billion. Looking ahead, we believe 2020 issuance could rise to about $95 billion, of which conduit totals $52 billion (55%) and SB at $43 billion (45%). For CRE CLOs, we project a year-end 2019 issuance volume of $19 billion-$21 billion before rising to $25 billion in 2020.
 Our projection factors in recent CRE sales,
forecasted allocations as well as the competitive
landscape. CRE transaction sales remain healthy,
with $279.6 billion YTD September 30 for the retail,
office, multifamily, and industrial sectors compared
to $268.5 billion for the same period last year. This
amounts to a YoY increase of 4.2%, based on our
analysis of CoStar data. Of these property types,
only retail experienced a decline (1.3%), while
multifamily had the largest increase (6%).
Our projection factors in recent CRE sales,
forecasted allocations as well as the competitive
landscape. CRE transaction sales remain healthy,
with $279.6 billion YTD September 30 for the retail,
office, multifamily, and industrial sectors compared
to $268.5 billion for the same period last year. This
amounts to a YoY increase of 4.2%, based on our
analysis of CoStar data. Of these property types,
only retail experienced a decline (1.3%), while
multifamily had the largest increase (6%).
According to the 2H 2019 CRE investment outlook
from the National Real Estate Investors/Marcus &
Millichap Investment Sentiment Survey,
commercial real estate offers favorable returns
relative to other asset classes and there is an
abundance of capital to invest. The survey reported
that 92% of respondents plan to increase (61%) or maintain (31%) CRE investment over the next 12 months. In
addition, according to a Hodes Weill/Columbia University survey, global institutions are raising their weighted CRE
asset allocations to 10.6% in 2020, or about 100 bps higher than in 2015. These surveys indicate that the appetite
for CRE investments remains intact (see Figure 7).
With long-term interest rates at low levels, conduit loan activity is expected to increase in 2020. In addition, with the
increase in conduit issuance, we could see some of the potentially smaller SB loans ending up in conduit executions.
We believe SB issuance will close 2020 at the higher end of our 2019 levels and should continue to benefit from the
ability of the securitized market to finance loans that maybe too large for other lenders. A case in point are Blackstone’s
two industrial property securitizations which include the largest deal ($5.6 billion) since pre-crisis—BX Commercial
Mortgage Trust 2019-XLP—as well as a scheduled $4 billion deal for the pending acquisition of Colony Capital’s
industrial property unit. In addition, as we observed in 2019, SB fixed rate deals are becoming an increasing form of
execution, which could be indicative of institutional borrowers seeking to lock in long-term rates. In 2018, 19 out of
84 SB deals (23%) were fixed rate compared to YTD September 30, 2019, when 19 out of 54 SB deals (35%) issued
were fixed rate.
CRE CLO issuance activity is expected to increase in 2020 based on current deal announcements, investor appetite
for yield, and favorable pricing and terms for issuers relative to other capital sources. Value-add and opportunistic
real estate investments remain desirable asset classes, while the flexibility that short-term CRE CLO loans afford to
borrowers should bode well moving forward. However, this is a securitized segment that faces a challenging
competitive landscape. According to Preqin—an alternative investment data provider—60% of closed-end private
real estate funds as of Q3 2019 have targeted value add and opportunistic investments.
Freddie Mac has issued $333.6 billion of K-Series certificates, of which $41.3 billion was issued YTD September
2019. On a YoY comparison, the K-Series increased by a moderate 3.7%. The increase was partly tempered as
Freddie Mac curbed some activity to meet its 2019 multifamily lending cap of $35 billion. The caps were introduced
over concerns that the agencies were pushing out the private multifamily market. As of October 1, 2019, the revised
limit is set at $100 billion for the five quarters between Q4 2019 and YE 2020. The new cap will now apply to all
multifamily businesses—in the past, several categories (including small balance and affordable housing) were
exempt from prior limits. Despite the volume, credit performance has been strong. A review of Freddie Mac’s KDeal Performance tables as of September 2019 indicates that 99.96% of the K-Series deals are current.
Economy, CRE Fundamentals, and Pricing With the U.S. now in its 125th month of economic expansion—and with positive GDP growth expected to continue for the foreseeable future—expectations are for the current expansion to continue its record-setting trend. And while manufacturing activity fell to a 10-year low in September, based on the ISM Manufacturing Purchasing Manager’s Index, a strong labor market (including an unemployment rate that touched on a 50-year low in September) has kept the economy and CRE prices on a steady growth path. Even though the U.S. is exhibiting signs of a slowdown, it is still growing, although at a slower pace versus 2018. Real gross domestic product increased at an annual rate of 1.9% in Q3 2019 compared to 2% in the prior quarter and 2.9% in Q3 2018, according to the Bureau of Economic Analysis (see Figure 8). Cushman & Wakefield in their U.S. Market 2Q 2019 Beat Report expects real GDP growth to be in the mid 2% range for 2019, which it believes is still a healthy backdrop for CRE.

Overall, property fundamentals remain positive due to strong tenant demand and supply constraints. CoStar reported
that office, retail, and industrial deliveries as a percentage of inventory averaged 0.2% over the last four quarters, or
one-half of the levels seen in 2007-08. However, as with any sector, results will vary by asset type. While the
national vacancy rate for office and multifamily fell YoY in Q3 2019, rates increased for industrial and retail but
was flat for lodging. Furthermore, CoStar forecasts that vacancies through 2023 will continue to rise, while rent
growth will experience a slowdown. In addition, the Urban Land Institute (ULI) expects national vacancy rates to
rise modestly in 2019-2021 for all property types. ULI’s semiannual September 2019 Real Estate Economic Forecast
also expects rents to continue to grow modestly over the three-year period. In addition, industrial rent growth which
is expected to average 3% will lead all categories, followed by multifamily (2.5%), office (2.1%), hotels (1.4% in
revenue per available room (RevPAR)), and neighborhood and community centers (1.3%). Bricks and mortar retail
will continue to struggle due to e-commerce growth and store closures.
While CRE prices continue their upward trajectory in line with the wider economy, a slowdown in price growth is
not unexpected this late in the cycle. The CoStar Commercial Repeat-Sale Index (CCRSI) Equal Weighted U.S.
Composite Index increased 2.5% in Q3 2019 and 7.1% YoY. The equal weighted index weighs each transaction
equally, regardless of the value of the transaction. The Value Weighted U.S. Composite Index rose 0.5% in Q3 and
8.2% YoY. The value weighted index reflects larger asset sales that are common in core markets. Both indices,
however, have declined from the double-digit annual growth rates recorded earlier in the cycle, according to CoStar.
As of September 2019, the equal and value weighted indices when comparing trough to current prices are 103.6%
and 121.1% higher, respectively. Even with the run-up in values, the prevailing view is that the next recession will
be less severe than the last one, due to the slow and steady expansion that has occurred in this economic cycle.
Property Types
Office
Allison Werry | (646) 731-2321 | awerry@kbra.com
Nationally, the overall office vacancy rate fell YoY in Q3 2019 to 9.7% from 9.8% (see Figure 9). The decline
was the ninth consecutive year of falling vacancies since a high of 13.1% in 2010. The vacancy rate is expected to
remain below 10% through Q1 2022, which is relatively low compared to historical levels.

 Average rental rates of $33.68 per square foot (sf)
reflect a 2.4% YoY increase as of Q3 2019, according
to CoStar. Technology and Sunbelt markets with
strong demographics continue to outperform,
including Austin (6.8% YoY rent growth), Charlotte
(6.4%), Seattle (6.3%), Jacksonville (5.6%), and East
Bay (5.5%). And while overall rent growth is
expected to remain positive on a national level, it will
likely slow to less than 2% in 2020 and 2021.
Average rental rates of $33.68 per square foot (sf)
reflect a 2.4% YoY increase as of Q3 2019, according
to CoStar. Technology and Sunbelt markets with
strong demographics continue to outperform,
including Austin (6.8% YoY rent growth), Charlotte
(6.4%), Seattle (6.3%), Jacksonville (5.6%), and East
Bay (5.5%). And while overall rent growth is
expected to remain positive on a national level, it will
likely slow to less than 2% in 2020 and 2021.
Construction completions are expected to reach 60.7
million sf in FY 2019, up 22.3% YoY from 49.6
million sf. Although absorption is forecast to
decrease 2.7% YoY, it should remain slightly
positive for FY 2019, resulting in a slight decline in
vacancies (see Figure 10). This absorption
momentum was partly due to multiple large-scale
tenants moving into new blocks of space, a trend that
is expected to continue over the next several quarters,
according to CoStar. Meanwhile, technology sector
tenants accounted for more than 26.4% of the leases
signed as of Q3 2019, or almost double the number
signed by financial services firms (13.7%), according
to Cushman & Wakefield.
The construction pipeline totaled 2.4% of U.S.
inventory as of Q3 2019, which is the largest share of
new construction since 2000, according to Cushman
& Wakefield. Markets where construction accounts
for the highest percentage of total inventory include
Austin (10.6%), San Mateo County, California
(10.3%), Nashville (10.1%), Charlotte (9.3%), Salt
Lake City (6%) and Midtown Manhattan (5.6%).
Office prices recorded a 2.4% increase in Q3 2019, based on CCRSI data. On a YoY period ending September
2019, office prices were up 3.8%. The CCRSI Prime Metro Index was up 3.5% YoY (see Figure 11).
 WeWork’s recent financial challenges, including its
failed initial public offering (IPO), have drawn
further attention to co-working, or flexible office
space. Despite the noteworthy growth of this sector
in recent years, flexible office space accounts for less
than 1.8% of total U.S. inventory as of Q2 2019,
according to CBRE Group Inc. The U.S. markets
with the largest share of this sector are San Francisco
(4%) and Manhattan (3.6%). WeWork is the largest
private-sector tenant in Manhattan, where the
company leases approximately 7.2 million sf.
According to a September Wall Street Journal article,
the vast majority of NYC landlords do not want to
lease space to WeWork while the company is
struggling financially. It can also make it harder to get
financing as lenders become wary of lending on
buildings with large WeWork exposure. In addition,
if the company’s financial situation continues to
decline, landlords with significant exposure to WeWork could have difficulty re-leasing the tenant’s spaces at
equivalent rental rates, particularly if coupled with any economic softness.
WeWork’s recent financial challenges, including its
failed initial public offering (IPO), have drawn
further attention to co-working, or flexible office
space. Despite the noteworthy growth of this sector
in recent years, flexible office space accounts for less
than 1.8% of total U.S. inventory as of Q2 2019,
according to CBRE Group Inc. The U.S. markets
with the largest share of this sector are San Francisco
(4%) and Manhattan (3.6%). WeWork is the largest
private-sector tenant in Manhattan, where the
company leases approximately 7.2 million sf.
According to a September Wall Street Journal article,
the vast majority of NYC landlords do not want to
lease space to WeWork while the company is
struggling financially. It can also make it harder to get
financing as lenders become wary of lending on
buildings with large WeWork exposure. In addition,
if the company’s financial situation continues to
decline, landlords with significant exposure to WeWork could have difficulty re-leasing the tenant’s spaces at
equivalent rental rates, particularly if coupled with any economic softness.
KBRA expects office properties to experience positive performance through 2020 based on stable property
fundamentals. However, if there is a more pronounced slowdown in economic growth, it could have an outsized
impact on market fundamentals in cities with excess supply, exposure to the oil and gas sector, or weak population
and employment metrics.
Retail
Robert Grenda | (215) 882-5494 | rgrenda@kbra.com
 The national retail vacancy rate rose to 4.5% in
Q3 2019, up 9 bps on a YoY basis, according to
CoStar data (see Figure 12). The vacancy rate has
tracked below 5% for 13 consecutive quarters and
under 6% for 21 straight quarters in a row. Net
completions are well below their pre-recession peak,
providing room for healthy net absorption that is being
driven by steady consumer spending and a stable
economy—despite a long list of tenant bankruptcies
and store closures over the past few years. Rent
growth on an annualized basis was modest at 1.3% in
Q3 2019 and is expected to inch above 1% in FY 2019,
CoStar reported. However, this is a sharp decline from
the prior six years, when average rent in the U.S. grew
by more than 2% annually.
The national retail vacancy rate rose to 4.5% in
Q3 2019, up 9 bps on a YoY basis, according to
CoStar data (see Figure 12). The vacancy rate has
tracked below 5% for 13 consecutive quarters and
under 6% for 21 straight quarters in a row. Net
completions are well below their pre-recession peak,
providing room for healthy net absorption that is being
driven by steady consumer spending and a stable
economy—despite a long list of tenant bankruptcies
and store closures over the past few years. Rent
growth on an annualized basis was modest at 1.3% in
Q3 2019 and is expected to inch above 1% in FY 2019,
CoStar reported. However, this is a sharp decline from
the prior six years, when average rent in the U.S. grew
by more than 2% annually.

 Construction activity is anticipated to pick up going
forward. After falling more than 35% in 2018,
CoStar projects net completions will rise 4.6% in
2019 before dropping nearly 20% in 2020 (see
Figure 13). Completions are then projected to rise
38.8% in 2021 and 27.9% in 2022. Net absorption
is expected to drop nearly 41% in 2019 before
picking up again in 2020. The impact on vacancies
should be negligible but rent growth will be muted.
CoStar projects a little over 1% growth in 2020,
followed by below 1% growth starting in 2021 and
continuing through to at least 2025.
Construction activity is anticipated to pick up going
forward. After falling more than 35% in 2018,
CoStar projects net completions will rise 4.6% in
2019 before dropping nearly 20% in 2020 (see
Figure 13). Completions are then projected to rise
38.8% in 2021 and 27.9% in 2022. Net absorption
is expected to drop nearly 41% in 2019 before
picking up again in 2020. The impact on vacancies
should be negligible but rent growth will be muted.
CoStar projects a little over 1% growth in 2020,
followed by below 1% growth starting in 2021 and
continuing through to at least 2025.
Among major property types in CCRSI, the U.S.
retail sector recorded the weakest price appreciation
in Q3 2019, with a paltry YoY gain of 0.8%.
CoStar’s Prime Retail Metros Index fared much
better, up 3.5% over the same period (see Figure 14).
Muted construction activity and investor demand for
high-quality properties are the main drivers of price
appreciation in the major markets.
Despite steady U.S. economic growth and record
low unemployment, retailers announced plans in
2019 to close roughly 155 million sf of store
space—an all-time record—according to CoStar.
Planned closures reached a new peak of more than
10,000 stores as of October, suggesting that
retrenchment will continue in 2020, owing to the
retail sector’s major structural challenges of
changing consumer preferences, e-commerce’s
steady assault, and fierce competition.
Among major retail categories, department stores
will remain under heavy pressure. While total U.S.
retail sales increased 4% YoY in Q3 2019, sales at
department stores fell 5.6%, extending a run of 14
consecutive years of annual declines, according to U.S. Census Bureau data. But despite its woes, physical retail is
surviving and, in some cases, thriving. CoStar reports that public retailers on average posted same-store sales growth
in 2017 and 2018. Coupled with the fact that comparable store space has been shrinking, as result of the record
number of store closures, this suggests that retailers are boosting sales productivity as they selectively reduce store
counts. As the sector continues to evolve, big-box retailers and debt-ridden chains will shutter more
underperforming stores. This will provide some landlords an opportunity to backfill with smaller, more productive
tenants paying higher rents. Low unemployment and steady economic growth are expected to continue to provide
tailwinds for the sector.
Lodging
Laura Wolinsky | (646) 731-2379 | lwolinsky@kbra.com
 Overall, U.S. lodging market fundamentals remain
positive with continued, albeit slow, RevPAR
growth of 0.7% through the YTD September 2019
period compared to prior year. The industry has
benefited from 112 months (out of the last 115
months) of RevPAR growth as of September 2019
(with the exclusion of September 2018, June 2019,
and September 2019 when there were slight
declines). U.S. occupancy and average daily rate
(ADR) are at all-time highs, although their rate of
growth has slowed considerably compared to prior
years (see Figure 15). National hotel demand and
supply growth are roughly equal, resulting in
flattening occupancy levels, with ADR being the
sole source of RevPAR growth. ADR increases are
also slowing and barely equate to inflation.
Overall, U.S. lodging market fundamentals remain
positive with continued, albeit slow, RevPAR
growth of 0.7% through the YTD September 2019
period compared to prior year. The industry has
benefited from 112 months (out of the last 115
months) of RevPAR growth as of September 2019
(with the exclusion of September 2018, June 2019,
and September 2019 when there were slight
declines). U.S. occupancy and average daily rate
(ADR) are at all-time highs, although their rate of
growth has slowed considerably compared to prior
years (see Figure 15). National hotel demand and
supply growth are roughly equal, resulting in
flattening occupancy levels, with ADR being the
sole source of RevPAR growth. ADR increases are
also slowing and barely equate to inflation.

A look at supply shows the total U.S. active pipeline at 661,000 rooms, up 9.1% YoY, according to Smith Travel
Research (STR) data (see Figure 16). The two top markets with the most rooms under construction as a percentage
of existing supply include Nashville (5,572 rooms, 12% of existing supply) and New York (14,437 rooms, 11% of
existing supply). However, the number of rooms under construction through August 2019 was approximately
207,000, which is still slightly below the historical peak of approximately 212,000 in December 2007.
Approximately 70% of the active pipeline is select-service construction. Hilton and Marriott brands account for
58% of the 207,000 in construction rooms.
Transaction volume decreased significantly for Q3 2019 for non-portfolio sales that are $10 million or greater.
According to the LW Hospitality Advisors Q3 2019 Major U.S. Hotel Sales Survey, there were 41 single asset
(13,100 hotel rooms) sale transactions totaling $3.72 billion or $283,000 per key. By comparison, the 2018 survey
identified 57 single asset (15,300 hotel rooms) sale transactions totaling $6.4 billion or $419,000 per room. LW
Hospitality reported that the U.S. hotel transaction market has slowed down with a growing disconnect between
seller prices and buyers’ bids.
According to CoStar, the U.S. Hospitality Index continues to exhibit steady growth (see Figure 17). In Q3 2019, it
increased 0.9%, up 7.9% YoY in the 12-month period ended September 2019.
 While headwinds exist that could disrupt lodging
sector performance, industry experts are forecasting
that lodging fundamentals will remain positive
through 2020. Occupancy is at an all-time high,
although increases in supply are expected to
continue to tamper occupancy growth levels.
Moderate ADR growth will drive future increases,
resulting in positive RevPAR growth.
While headwinds exist that could disrupt lodging
sector performance, industry experts are forecasting
that lodging fundamentals will remain positive
through 2020. Occupancy is at an all-time high,
although increases in supply are expected to
continue to tamper occupancy growth levels.
Moderate ADR growth will drive future increases,
resulting in positive RevPAR growth.
Leading sector analysts expect continued supply
growth around or above the long-term average of
1.9% in both 2019 and 2020, resulting in a relatively
flat occupancy and only a slight increase in ADR.
RevPAR is expected to continue to grow in 2019
and 2020, albeit at the lowest levels since the Great
Recession (see Figure 18).

Multifamily
Gabriela Hodara | (646) 731-2499 | ghodara@kbra.com
 Favorable rental housing demand, including steady
job growth and household formations, should
provide the sector with healthy property
fundamentals for the remainder of 2019 and into the
new year. As of September 2019, CoStar reported a
5.8% vacancy rate, which decreased from 6.1% on a
YoY comparison. The multifamily vacancy rate is
forecast to increase to 6.1% in the period to TTM
September 2020 but should remain below the 15-
year average vacancy rate of 6.4%. While vacancy
rates are expected to rise, apartment owners should
be able to continue raising rents—albeit modestly—
at current levels. Average rental rates of $1,355 per
unit reflect a 3.8% YoY increase and are projected to
rise 1.3% in 2020 (see Figure 19).
Favorable rental housing demand, including steady
job growth and household formations, should
provide the sector with healthy property
fundamentals for the remainder of 2019 and into the
new year. As of September 2019, CoStar reported a
5.8% vacancy rate, which decreased from 6.1% on a
YoY comparison. The multifamily vacancy rate is
forecast to increase to 6.1% in the period to TTM
September 2020 but should remain below the 15-
year average vacancy rate of 6.4%. While vacancy
rates are expected to rise, apartment owners should
be able to continue raising rents—albeit modestly—
at current levels. Average rental rates of $1,355 per
unit reflect a 3.8% YoY increase and are projected to
rise 1.3% in 2020 (see Figure 19).

 According to the Freddie Mac Multifamily 2019 Midyear
Outlook, household demand continues to outpace total
supply. The U.S. Census Bureau reported a 1.4 million
increase in total households each year for the past three
years, which compares to 1.1 million housing units
completed over the same time period. Demographics and
lifestyle preferences continue to support the demand for
multifamily housing, with baby boomers looking to
downsize and millennials, as well as others, flocking to
more affordable rental units. This is supported by a survey
conducted by Freddie Mac in April 2019 indicating that
82% of renters believe that renting is more affordable than
owning, an increase of 15 points from its February 2018
survey. In addition, based on the low interest rates, strong
fundamentals and investor demand, Freddie Mac predicts
that multifamily originations will set another record year
in 2019 for a total origination volume of $311 billion,
representing a 9.1% YoY increase.
According to the Freddie Mac Multifamily 2019 Midyear
Outlook, household demand continues to outpace total
supply. The U.S. Census Bureau reported a 1.4 million
increase in total households each year for the past three
years, which compares to 1.1 million housing units
completed over the same time period. Demographics and
lifestyle preferences continue to support the demand for
multifamily housing, with baby boomers looking to
downsize and millennials, as well as others, flocking to
more affordable rental units. This is supported by a survey
conducted by Freddie Mac in April 2019 indicating that
82% of renters believe that renting is more affordable than
owning, an increase of 15 points from its February 2018
survey. In addition, based on the low interest rates, strong
fundamentals and investor demand, Freddie Mac predicts
that multifamily originations will set another record year
in 2019 for a total origination volume of $311 billion,
representing a 9.1% YoY increase.
While the multifamily market continues to moderate
from cyclical highs based on the concentration of new
supply, it has remained healthy so far in 2019.
Multifamily construction is expected to stay strong in
2019, then decelerate in 2020. New construction
deliveries forecasted for FY 2019 are estimated to
decrease 7.8% from the prior year; however, the 12-
month period represents the sixth consecutive year
since the Great Recession that more than 250,000 units
were scheduled to be delivered to the marketplace.
Absorptions are expected to continue the trend of
outpacing completions by 14.6% for FY 2019 (see
Figure 20). The multifamily sector has continued to
perform well despite the active development pipeline.
The mismatch of supply and demand for new
multifamily assets is expected to be short-lived due to
projected reductions in new construction, coupled with
continued demographic trends and above-average job growth for some metropolitan areas. As a result, multifamily
rental demand is forecasted to remain stable over the longer term.
According to CCRSI, the multifamily sector posted a 1.8% price increase in Q3 2019 (See Figure 21). For the 12-
month period ending September 2019, prices grew by 6.9%. For the same time period, the CCRSI Prime Metro
Index for multifamily increased by a slightly lower rate of 6.3%. Multifamily continues to maintain one of the
strongest property type indices in this cycle, according to CoStar.
Rental reform regulations have become one of the top multifamily issues in 2019 as governments try to solve housing
affordability issues, impacting both small landlords as well as institutional investors. With Oregon setting a precedent,
California and New York created new rent reform regulations this year. The level of uncertainty around the rental reform
laws is expected to impact investment sales and could cause price volatility as investors assess the impact of the new laws.
Industrial
Allison Werry | (646) 731-2321 | awerry@kbra.com

 CoStar reported that the national industrial vacancy
rate increased to 5.1% in Q3 2019, up from 4.7% in
the prior year, marking the end to a nine-year period
of annual declines. Vacancy rates are anticipated to
increase to 5.7% by YE 2020 and 5.9% by YE 2021
due to unprecedented new supply combined with
moderate economic growth. Despite the expected
increase, these rates remain near all-time lows
(see Figure 22).
CoStar reported that the national industrial vacancy
rate increased to 5.1% in Q3 2019, up from 4.7% in
the prior year, marking the end to a nine-year period
of annual declines. Vacancy rates are anticipated to
increase to 5.7% by YE 2020 and 5.9% by YE 2021
due to unprecedented new supply combined with
moderate economic growth. Despite the expected
increase, these rates remain near all-time lows
(see Figure 22).
Average rental rates of $8.64 per sf reflect a YoY
increase of 5.1% as of Q3 2019, which is slightly
lower than the annual average increase dating back to
2015. Although growth is expected to slow to 3.9%
YoY in 2020, CoStar estimates that e-commerce will
continue to drive rents higher as demand for bulk
distribution and infill logistics product remains strong.
Affordable regional distribution locations such as
Providence, Stockton, Las Vegas, and Sacramento
have led market rent growth. According to Cushman
& Wakefield, the weighted average rents for logistical
product have increased at more than twice the rate of
overall industrial during the past year.
Last-mile distribution centers near areas with
significant population remain in high demand. A
340,000 sf, three-story logistics center is planned to
open in the Red Hook neighborhood of Brooklyn,
New York, in late 2020. When it opens, it will be the
tallest distribution center on the East Coast, according
to CoStar Group.
CoStar reports that industrial completions are
estimated to reach 253.4 million sf for FY 2019,
which reflects a 16.3% increase YoY. Absorptions
are expected to decline 41.5% YoY at 145.5 million sf in 2019, marking the first year since 2009 that completions
have exceeded absorption (see Figure 23). In addition, construction deliveries will likely reach record levels in Q4
2019 and Q1 2020, with more than 60% of this space developed on a speculative basis. Construction is currently
concentrated in seven markets where demand has been consistently strong. According to Cushman & Wakefield,
Dallas/Fort Worth, the Inland Empire, the Pennsylvania I-81 & I-78 Distribution Corridor, Chicago, Houston,
Atlanta, and Indianapolis account for more than 10 million sf under construction, or 44% of the pipeline.
 Based on the CCRSI, industrial prices rose 3.4% on a
September 2019 YoY comparison. The CCRSI Prime
Metro Index indicated that price growth was higher at
5.0% YoY (see Figure 24).
Based on the CCRSI, industrial prices rose 3.4% on a
September 2019 YoY comparison. The CCRSI Prime
Metro Index indicated that price growth was higher at
5.0% YoY (see Figure 24).
KBRA expects industrial properties to continue to
have good performance through 2020, although new
supply will cause higher vacancy rates and limited
rent growth. Although strong consumer confidence
has driven online retail sales higher in recent years,
trade uncertainty and manufacturing weakness could
negatively impact this sector’s overall performance.
Conduit Credit Metrics
As conduit transactions continue to represent a
sizeable proportion of the CRE securitization
universe, they continue to be a good barometer of
credit conditions for newly originated loans. Figure 25
highlights the key credit metrics for KBRA-rated deals dating back to 2012. The figures, along with other deal
metrics, are available with the KBRA Comparative Analytic Tool (KCAT) spreadsheets that accompany our conduit
pre-sales and monthly Trend Watch publications.

*As of November 7, 2019. Source: KBRA After reaching a multiyear high in 2015 (102.9%), KBRA loan-to-value (KLTV) began to trend lower before edging up in 2018. However, its movement year-to-date has been more pronounced, at 97.6%. The Q4 2019 average through November 7, at 101.7%, has certainly impacted the overall statistic. Full-term IO loans have also been exhibiting a more noticeable movement reaching 58.1% YTD, an all-time high. This has contributed to the rise in debt service charges (DSCs), which increased to 2.03x YTD compared to 1.92x for FY 2018.
The following are highlights of key metrics that we observed among the CMBS conduits that KBRA has rated so far this year:
 The KBRA IO Index trended upward in 1H 2019 to
64.2% from 58.7% in FY 2018. The index continued its
rise to 75.6% in Q4, reaching an all-time YTD high of
65.7%. The pool’s weighted average IO index provides
a measure of a transaction’s exposure to interest-only
loans. It is compiled for each transaction by first
calculating an IO index for each loan, which is the
number of IO payments divided by the loan term. The
increase in the IO index has been heavily influenced by
the growing proportion of full-term IOs which, when
added to the partial IOs, aggregated 82.1% YTD.
▪ In-Trust KLTV was 97.6% YTD, with an All-In Cutoff
KLTV of 104.6%. The All-In KLTV since 2014 has
been between 103.2% and 107.6%. Subordinate debt
during this period was somewhat more volatile from its
low of 22.8% in 2015 to 31% in 2017.
The KBRA IO Index trended upward in 1H 2019 to
64.2% from 58.7% in FY 2018. The index continued its
rise to 75.6% in Q4, reaching an all-time YTD high of
65.7%. The pool’s weighted average IO index provides
a measure of a transaction’s exposure to interest-only
loans. It is compiled for each transaction by first
calculating an IO index for each loan, which is the
number of IO payments divided by the loan term. The
increase in the IO index has been heavily influenced by
the growing proportion of full-term IOs which, when
added to the partial IOs, aggregated 82.1% YTD.
▪ In-Trust KLTV was 97.6% YTD, with an All-In Cutoff
KLTV of 104.6%. The All-In KLTV since 2014 has
been between 103.2% and 107.6%. Subordinate debt
during this period was somewhat more volatile from its
low of 22.8% in 2015 to 31% in 2017.
▪ YTD KDSC increased to 2.03x from 1.92x FY 2018,
which is the highest it has been since 2012, with 2017 closely behind at 2.0x. This year’s figure has been influenced
by the growing full-term IO exposure, as well as lower leverage loans that tend to have higher In-Trust KDSCs.
▪ YTD, the average proportion of loans secured by assets situated in primary markets rose by 280 bps to 50.6%
compared to 2018, while secondary and tertiary market exposure fell by 150 bps (36.3%) and 130 bps (13.1%),
respectively.3 This could reflect the flight to safety found in the higher capitalized, more liquid core markets.
▪ Single tenant concentrations reversed trend after rising for six consecutive years, falling 150bps to 17.9% YoY.
Despite this, the concentration remains elevated and is noteworthy as single-tenant properties present higher
credit risk than multi-tenant properties, since the sole source of income is generated by one lessee.
▪ Retail exposure reached an all-time low at 24.1% YTD 2019 compared to its 2.0 peak of 38.0% in 2012. Except
for lodging, all of the major property types picked up retails’ reduced exposure. Lodging is currently at its lowest
2.0 conduit contribution rate, at 11.9%. The highest exposure currently is office (35.1%), followed by retail and
multifamily (15.4%) which increased in Q4 (see Figure 26). The increase partly reflects Freddie Mac’s reduced
level of originations which began to be observed in September, as they did not want to surpass their 2019
multifamily lending cap of $35 billion. For the purposes of calculating property type exposure, we allocated
mixed-use assets to the property types based on the component uses of the individual properties. The allocation
generally relied on the relative economic contribution of each mixed-use component.
▪ KBRA’s capitalization rate declined to 9.08% YTD 2019 from 9.37% in 2018. This YTD figure is the lowest it
has been since 2012. This was partly attributable to the shift to primary markets, which tend to have a lower risk
profile than secondary and tertiary markets.
With both short- and long-term interest rates at favorable levels, overall CRE lending including securitized product should
remain strong in 2020. But, as we have recently experienced, the Federal Reserve has no qualms in adjusting its monetary
policy and if it becomes less accommodative, it could again cause disruptions in the lending and credit markets.
3 We identified 17 market tiers, which we define as areas with a market capitalization of over $75 billion. Primary markets that are among the largest MSAs were classified as
tier 1A markets, and include Boston, Chicago, Los Angeles, New York, San Francisco, and Washington D.C. KBRA considers these MSAs to be core infill urban markets
that offer investors superior liquidity relative to the rest of the nation. The remaining markets were classified as follows: tier 1B consists of the remaining 11 MSAs among
the primary markets; tier 2A consists of secondary MSAs that rank from 18 to 50 based on market capitalization while tier 2B secondary markets rank from 51 to 100. We
consider all other markets to be tertiary.
Surveillance
After a credit rating is assigned, the KBRA CMBS surveillance team actively monitors all outstanding CMBS
ratings for the life of each transaction. The KBRA surveillance team also conducts monthly reviews of its
outstanding CMBS ratings through the review of trustee, remittance, and servicer data as available via Trepp.
Depending on our findings from these reviews, as well as other information that we evaluate (including media news
and post-securitization events), a transaction may be selected for a review.
As of October 31, 2019, our surveillance portfolio included 5,025 CRE ratings across 465 transactions with a total
outstanding balance of $395 billion (see Figure 27). Conduit transactions comprised the largest transaction type
(56% of outstanding principal balance) followed by Freddie Mac K-Series (18%).

When reviewing our timeline of rating actions, there were no positive or negative rating actions effectuated in 2011
and 2012. Starting in 2013 and continuing through 2015, only upgrades were initiated. These were primarily due to
loan paydowns, defeasance, and improved collateral performance. In 2016, we had our first downgrades (11) which
continued but at fairly flat levels in 2017 (12). By 2018, downgrades had more than doubled (27) and YTD are
already higher by 70% (46). The downgrades have also tracked the upward trend in KBRA Loans of Concern (KLOCs), which ended 2017 at 602 (3.4% of KBRA outstanding principal balance at that time) and by October 2019
were 48% higher at 891 (3.9%). Of the 891 K-LOCs, retail had the largest number of loans (287), accounting for
almost one-third of the total.
K-LOCs identify loan credit risk well in advance of defaults and serve as an indicator of potential collateral problems
that could manifest into major issues down the road. While K-LOCs are only one consideration in the ratings
process, loss estimates on them can contribute to transaction downgrades.
Overall, ratings were stable YTD October 31 as 95.7% were affirmed. As forecasted in KBRA’s 2019 CMBS
Outlook—we correctly forecast that the upgrade/downgrade ratio would compress further in 2019. Year-to-date,
there were 117 upgrades and 46 downgrades (upgrade/downgrade ratio of 2.5 to 1) compared to FY 2018, when
there were 119 upgrades and 27 downgrades (4.4 to 1). However, when examining the rating actions by transaction
type, downgrades were dominated by conduit transactions (38), with the others among large loan deals (8).
While we would expect the upgrade/downgrade ratio to compress as transactions season and we get further along in the economic cycle, many of the downgrades so far were event-driven, reflecting oil price declines and the onset of e-commerce’s effect on brick and mortar retail.

KBRA’s rated universe comprises transactions from 2011 through to this year. The earlier vintages have benefited from strong price growth. For example, the 2012-2013 vintages experienced price increases of 91% and 79%, respectively through September. This contributed to the relatively strong upgrade/downgrade ratios. However, interrupting the positive trend was the collapse in West Texas Intermediate (WTI) oil prices. WTI, which peaked at $106.10 per barrel on June 6, 2014, fell almost 50% to $53.40 per barrel by year end. Along with its fall came significant declines in property operating net cash flow for properties located in the oil-related economies such as
North Dakota and Houston. Some of the event-driven
ratings impact that occurred in 2014 carried over to
vintage year 2015, as not all CMBS lenders had yet
to leave the oil patch (see Figure 29).
 The Mall Effect: Store Closures, Loan
Maturities, and Modifications
In the YTD October 2019 period, two of the
downgrades (4.3% of total) moved to non-investment
grade from investment grade. Each were in a separate
transaction and both were lowered to BB (sf) and BB-
(sf), respectively, from their lowest investment-grade
class of BBB- (sf). The highest rating that was
downgraded YTD came from a third transaction and
moved to BBB (sf) from A- (sf). All three transactions
had retail malls driving the downgrades.
The Mall Effect: Store Closures, Loan
Maturities, and Modifications
In the YTD October 2019 period, two of the
downgrades (4.3% of total) moved to non-investment
grade from investment grade. Each were in a separate
transaction and both were lowered to BB (sf) and BB-
(sf), respectively, from their lowest investment-grade
class of BBB- (sf). The highest rating that was
downgraded YTD came from a third transaction and
moved to BBB (sf) from A- (sf). All three transactions
had retail malls driving the downgrades.
The CG-CCRE 2014-FL1 floating-rate large loan transaction, which was initially collateralized by three loans,
suffered from adverse selection as two of the better performing loans paid off, leaving the deal with the
underperforming Yorktown Center. The property, which is primarily collateralized by a super-regional mall,
transferred to the special servicer in October 2018 for imminent maturity default. The loan was subsequently modified
with a 12-month maturity extension to March 2020. In total, five classes were downgraded, including the BBB- (sf)
to BB (sf) rating. In addition, four of the five downgrades were on Watch Developing prior to the rating actions.
GSMS 2014-GC18 had four classes downgraded, including the BBB- (sf) rated class that moved to BB- (sf). The
Wyoming Valley Mall (8% of principal balance) is a super-regional mall located in Wilkes-Barre, Pennsylvania.
The property included two anchor tenants, Bon-Ton and Sears, which closed their stores. The loan was transferred
to the special servicer in June 2018 due to imminent monetary default. Based on our analysis, at the time of the
downgrades, KBRA Net Cash Flow (KNCF) had declined 38.8% since issuance. In addition to the estimated loss
for this K-LOC (69.4%), three other assets had loss estimates ranging from 10.9% to 54.8%. Prior to the downgrades,
the lowered rated classes were on Watch Downgrade.
The other notable mall deal that brought down the highest rated class YTD of A- (sf) to BBB (sf) was in the JPMCC
2014 DSTY transaction. The collateral consists of two loans each secured by separate phases of the Destiny USA
super-regional mall in Syracuse, New York. The loan was transferred to the special servicer in March 2019 for
imminent maturity default. Based on our analysis of the collateral, KNCF declined 24% since issuance, driving its
LTV to 111.8% from 82.7% at issuance. The loan was eventually modified with a one-year maturity extension
subject to its meeting a debt yield test. A cash flow sweep was also set up, with an initial deposit funded by the
borrower of $6 million.
Based on a review of 10-year loans that come due in 2020 ($2.7 billion), which was reported in our September 2019
Trend Watch, malls accounted for the largest percentage of the maturing population (35.5%). We believe that B/C
malls may struggle in finding financing as they have generally fallen out of favor except for top-tier malls with high
sales. Where inline sales per sf were available for this population, many properties fell within the $300 to $400
range. While the inline sales information was generally dated, it suggests that these mall loans may face refinancing
challenges which could potentially trigger downgrades for the deals that contain the underlying collateral.
With the length of the economic expansion continuing into uncharted territory and the Federal Reserve’s three rate
cuts so far in 2019, the positive momentum that CRE has experienced should carry over into 2020. This should help
to support property collateral performance and upgrades in the new year. However, as we believe that property
operating cash flows and valuations may have their best years behind them, upgrades may level off and even decline.
With the increasing levels of K-LOCs, more downgrades could follow due to property underperformance. These
factors should continue the compression in the upgrade/downgrade ratio that we have experienced over the last few
years into 2020.